In the dynamic world of day trading, understanding the subtleties of market indicators can be the difference between success and failure. This comprehensive guide is dedicated to unveiling the power of Relative Volume (RVOL) in trading, an essential tool for traders looking to harness market movements to their advantage. Our aim is to equip you with the knowledge and tools to optimize your trading strategies through the effective use of Relative Volume. Whether you’re a novice learning the ropes or a seasoned trader seeking to refine your approach, this article is your gateway to mastering Relative Volume.
What is Relative Volume?
In the bustling world of day trading, where every tick of the market can herald new opportunities or signal caution, the savvy trader knows the value of every tool in their arsenal. One such tool, often the unsung hero of the trading strategy, is Relative Volume (RVOL). Let’s explore what makes Relative Volume a critical indicator for traders, whether you’re just starting out or are looking to refine your approach with more nuanced insights.
Definition and Overview

“Relative Volume helps you “feel” the market’s energy by comparing current trading volume to the usual volume for the same time of day“.
– Chart Spots
At its core, Relative Volume is not just about numbers—it’s about context. Imagine walking into a room and sensing the energy; in trading, Relative Volume helps you “feel” the market’s energy by comparing current trading volume to the usual volume for the same time of day. It’s a ratio, a way to measure if there’s more or less activity than expected. When we talk about RVOL, we’re looking at how today’s volume stacks up against past performance over a specific period. This comparison gives traders a deeper understanding of the market’s enthusiasm or lack thereof for a particular stock or asset.
Importance in Day Trading
Why does RVOL matter for day traders? Because in the fast-paced world of day trading, being able to quickly identify where the action is heating up can mean the difference between catching a wave or missing out. High Volume compared to the Relative Volume of that time-period indicates significant interest in a stock, often preceding price movements. It’s like having a radar for market momentum, enabling traders to spot potential entry and exit points more effectively. Whether you’re looking to jump on a breakout before it happens or find a quiet spot for a mean reversion play, RVOL provides the insights needed to make those decisions with confidence.

Difference Between Volume and Relative Volume
Now, you might wonder, “Isn’t volume enough? Why do I need to know the Relative Volume?” Here’s the thing: while volume tells you how many shares were traded, it doesn’t give you the whole picture. Consider volume as the raw data, the sheer quantity of shares changing hands. In contrast, Relative Volume is about perspective. It tells you how the current volume compares to what’s typical for that time of day or that period in the market.
Imagine you’re looking at a stock with a million shares traded in the first hour of the trading day. Impressive, right? But what if I told you that on average, this stock sees two million shares traded in the same hour? Suddenly, that “impressive” volume might not seem so noteworthy. This is where Relative Volume shines, offering a lens through which to view volume not just as a number, but as a marker of significance or deviation from the norm.
For day traders, this distinction is crucial. It’s not just about how much is being traded, but how that amount compares to the expected trading activity. Volume significantly higher than its Relative Volume can be a beacon, highlighting that the asset is attracting more attention than usual, potentially signalling a move. Conversely, volume lower than its Relative Volume might suggest caution, indicating less interest than anticipated.

“Relative Volume compares current Volume to what’s typical for that time of day “.
– Chart Spots
Understanding the Relative Volume Indicator
What is the Relative Volume Indicator?
The Relative Volume indicator is a powerful tool that measures the current volume of trading for a specific period against the average volume for the same period over a longer timeframe. It highlights when trading activity is unusually high or low, offering clues about potential market moves. This insight is invaluable because it allows traders to gauge the strength behind price movements, distinguishing between those with significant backing and mere noise.
How to Calculate Relative Volume
Calculating RVOL might sound like you need a PhD in mathematics, but it’s actually quite straightforward. Here’s a simplified version to get you started:
- Determine the average volume for a specific time period (like the first 30 minutes of the trading day) over a set number of previous sessions (say, 10 days).
- Compare the current session’s volume for that same period to the average you just calculated.
- The ratio of the current volume to the average volume gives you the Relative Volume Factor.
For instance, if the average volume for the first 30 minutes over 10 days is 100,000 shares and today’s volume for that period is 150,000 shares, the RVOL factor is 1.5. This indicates that today’s trading activity is 50% higher than the average, suggesting increased interest or activity in that asset.
Relative Volume Indicator for NinjaTrader 8: An Introduction
In NinjaTrader 8, a popular trading platform known for its advanced analysis capabilities, you can use the Chart Spots Relative Volume indicator, making it easier for traders to implement this analysis in their strategy. This tool automatically calculates and displays RVol, freeing you from manual calculations and allowing you to focus on what matters most—making strategic trading decisions.
Integrating the RVol indicator into your NinjaTrader 8 platform enhances your trading in several ways:
- Real-time Insights: Get instant analysis of trading volume compared to historical averages, helping you spot trends as they develop.
- Customization: Adjust the settings to match your trading style, whether you’re a rapid day trader or looking for longer-term volume trends.
- Strategic Advantage: Use RVol to pinpoint entry and exit points, identify potential breakouts or reversals, and confirm the strength behind price movements.
Relative Volume indicator for NT8
Boost your trading game with ChartSpots’ Relative Volume (RVOL) indicator. Witness real-time volume insights and catch market moves early with our 2-week free trial!
The Strategic Edge of Relative Volume
Let’s explore the foundational strategies around RVOL, explore its capabilities in detecting potential crucial market movements like mean reversion and breakouts, and discuss what makes a good RVOL figure for day trading.
Relative Volume Trading Strategy: The Basics
At its core, a Relative Volume trading strategy leverages the indicator to identify anomalies in trading volume—times when the activity is significantly higher or lower than the norm. These anomalies often precede pivotal market movements, providing a cue for traders to anticipate and react to upcoming opportunities.
A basic RVOL strategy involves:
- Setting a Benchmark: Determine the average volume for a specific timeframe across a predefined number of days. The RVOL indicator will calculate this for you.
- Identifying Anomalies: Look for significant deviations from this average during the trading day.
- Acting on Insights: Use these deviations to inform your trading decisions, entering or exiting positions based on the strength and direction of the volume anomaly.
Detecting Mean Reversion and Breakouts with RVOL
- Mean Reversion: This strategy is based on the principle that prices eventually move back towards the mean or average. Low volume compared to RVOL readings can signal that a stock has deviated too far from its typical range, suggesting a potential reversal. For instance, a significantly low volume compared to RVOL during a price spike may indicate an overbought or oversold condition, hinting at a forthcoming correction towards the mean.
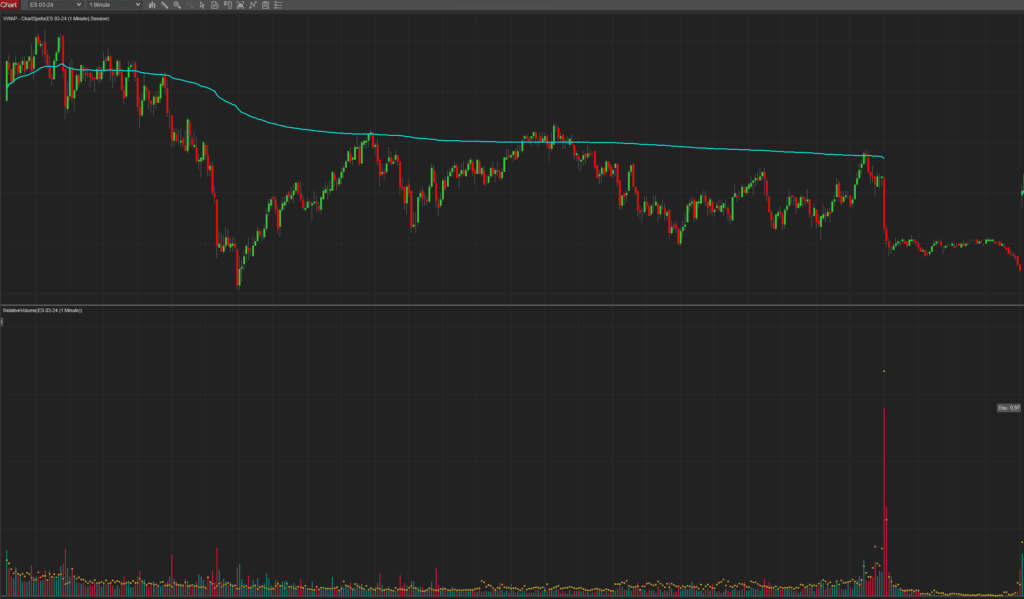


In this example the Relative Volume Factor for the day is 0.97: meaning completely average volume. In the Price Action, we see that the price keeps reverting to the mean Volume Weighted Average Price (VWAP)
- Breakouts: Breakouts occur when a stock moves outside a defined support or resistance level with increased volume. Here, RVOL is your early-warning radar. Elevated volume compared to RVOL ahead of a price moving beyond a consolidation range suggests strong market interest and backing for the move, increasing the likelihood of a successful breakout. Conversely, a breakout without a corresponding spike in RVOL may lack the momentum to sustain, signalling caution.
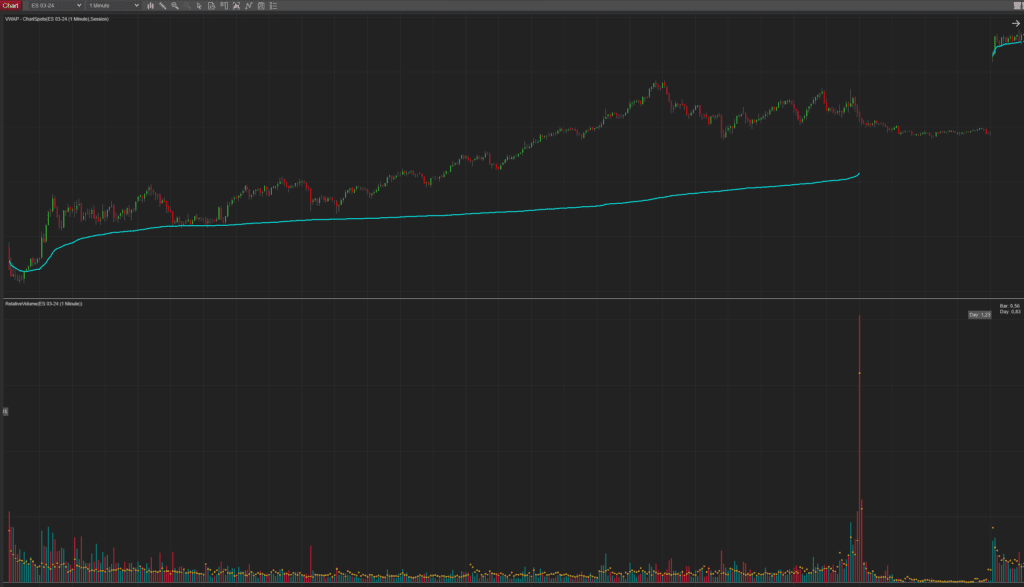
Early on in the session, we see volume consistently exceeding the Relative Volume (orange dots). The Factor for the day ends up at 1.25: meaning significantly higher volume than usual. The Price Actions shows an upward trend. The next Session opened above the prior session’s range.
What Constitutes a Good Relative Volume for Day Trading?
A “good” RVOL figure isn’t one-size-fits-all; it’s contextual, varying across stocks and market conditions. However, there are general guidelines to help you interpret RVOL values effectively:
- Above Average: Typically, an RVOL factor greater than 1 (indicating volume higher than RVOL) is considered significant, suggesting heightened trading interest.
- Thresholds for Action: Many traders look for volume 2 to 3 times the RVOL as strong indicators of potential trading opportunities. These levels signify not just interest but potential conviction in the asset price direction.
- Adjusting for Context: The significance of a given RVOL also depends on the context—time of day, news releases, and overall market sentiment. High Volume compared to RVOL at market open might be less indicative than the same reading in a midday lull.
Incorporating RVOL into your day trading strategy offers a distinct edge, allowing you to navigate the markets with an informed perspective. This strategic edge is about more than just following numbers; it’s about interpreting what they signify in the broader market narrative and how they align with your trading philosophy and strategy.
Historical Data: How Much is Enough?
Traders often find themselves asking, “How much historical data do I really need as a basis for the RVOL calculation?” When it comes to leveraging Relative Volume (RVOL) for your trading strategy, the answer isn’t just about quantity but about the quality and relevance of the data you choose to analyze. Let’s explore the critical role historical data plays in RVOL analysis and how to determine the right amount to enhance your trading effectiveness.
The Role of Historical Data in Relative Volume Analysis
Historical data serves as the bedrock of RVOL calculations, providing the context necessary to interpret current volume activity. Think of it as the backstory to a novel; without understanding the characters’ pasts, their actions in the present may seem random or confusing. Similarly, without a backdrop of historical volume data, today’s volume spikes or drops could lead to misinterpretation.
Historical data allows traders to:
- Establish Baselines: It helps in setting average volumes for comparison, which are crucial for identifying significant deviations.
- Identify Patterns: Recognizing recurring volume patterns during specific times of the day, week, or in response to market events can inform anticipatory trading strategies.
- Assess Volatility and Trend Strength: Historical volume trends can indicate the robustness of current market movements, distinguishing between fleeting fluctuations and sustainable trends.
Determining the Optimal Amount of Historical Data for RVOL calculation
Finding the sweet spot for the amount of historical data requires a balance between comprehensiveness and relevance. Too little data might not provide a reliable average, while too much could dilute recent trends with outdated information. Here’s how to strike that balance:
- Consider the Trading Timeframe: If you’re a day trader, focusing on the last 10 to 30 trading days can offer a relevant average. This period provides a snapshot of recent market behaviour without overwhelming you with excess information that might not be relevant today.
- Adjust for Market Conditions: During periods of significant market upheaval or volatility, it may be beneficial to shorten your historical data window. This adjustment ensures your RVOL calculations reflect the current trading environment more accurately.
- Sector and Stock Specifics: Different sectors and stocks might warrant adjustments in your historical data range. High-growth tech stocks or sectors with recent catalysts (like regulatory changes) might require a closer look at more recent data to capture the latest market dynamics.
- Regular Reviews and Adjustments: As your trading strategy evolves and market conditions change, revisit your historical data parameters. What worked in a bull market might need tweaking in bearish conditions.
- Utilize Technology: The RVOL Indicator for NinjaTrader 8 automates and adjusts the calculation of RVOL based on your specified historical data range. This range is called the Lookback days in the indicator configuration. Leverage these features to maintain the optimal balance as you refine your trading approach.
In essence, the “right” amount of historical data varies among traders and their strategies, but the goal remains the same: to leverage RVOL in a way that enhances your understanding of market movements and improves your trading decisions. By thoughtfully selecting your historical data window, you ensure that your RVOL analysis is both relevant and actionable, giving you a clearer picture of the market and a strategic edge in your trading endeavours.
Optimizing Your Trading Strategy with Relative Volume
As day traders, we’re in a constant quest to refine our strategies and edge out the competition. Incorporating Relative Volume (RVOL) into your trading toolkit can be a game-changer, offering insights that go beyond mere price movements to reveal the momentum behind them. Let’s dive into the best practices for integrating RVOL into your day trading strategy and share some insider tips and tricks for maximizing its effectiveness.
Best Practices for Integrating Relative Volume into Your Day Trading Strategy
- Combine RVOL with Price Action: While RVOL can provide a snapshot of market sentiment and activity levels, pairing it with price action analysis offers a comprehensive view. Look for discrepancies between volume spikes and price movements. For instance, volume exceeding RVOL without a significant price change could indicate a pending movement.
- Use RVOL as a Confirmation Tool: Before making a move based on other indicators or chart patterns, check the RVOL for confirmation. A breakout or trend reversal accompanied by significantly higher volume compared to RVOL provides added confidence in the trade’s potential success.
- Set RVOL Thresholds: Establish specific RVOL levels that signal trading opportunities for you. This could mean trading only when the volume is above a certain multiplier of RVOL, indicating unusual activity that could lead to profitable movements.
- Adjust Settings for Market Conditions: No two trading days are alike, and market volatility can affect the relevance of your RVOL settings. Be prepared to adjust your RVOL thresholds based on overall market conditions or specific news affecting your trading instruments.
Tips and Tricks for Maximizing the Effectiveness of Relative Volume Analysis
- Leverage Alerts: Many trading platforms allow you to set alerts for when volume exceeds RVOL. Utilize these alerts to ensure you never miss a potential opportunity, even if you’re not actively watching the charts every second.
- Historical RVOL Analysis: Periodically review past trades and the RVOL at those times. This retrospective look can help you refine your thresholds and strategy, ensuring they remain aligned with the market’s evolving dynamics.
- Sector and Market Sensitivity: Pay attention to how different sectors respond to RVOL signals. Some sectors may exhibit stronger reactions to volume anomalies, offering more pronounced opportunities for traders who can spot these trends.
- Journaling and Review: Keep a detailed journal of your trades, including volume and RVOL data, and regularly review this journal to identify patterns in your successful and unsuccessful trades. This practice can reveal insights into how best to utilize RVOL in your specific trading strategy.
Integrating Relative Volume into your day trading strategy isn’t just about adding another tool to your arsenal; it’s about deepening your understanding of market dynamics and enhancing your decision-making process. By following these best practices and tips, you’re not just trading; you’re trading with insight, precision, and an edge that can significantly increase your chances of success in the fast-paced world of trading.
Conclusion: Harnessing the Power of Relative Volume in Day Trading
As we wrap up our comprehensive journey through the world of Relative Volume (RVOL) in day trading, it’s clear that this dynamic indicator is more than just a metric—it’s a lens through which savvy traders can view the market, revealing the underlying momentum and sentiment driving price movements. Let’s distil our exploration into key takeaways and encourage you to integrate RVOL into your trading strategy, unlocking new levels of market success.
Key Takeaways on the Importance and Application of Relative Volume
- RVOL as a Market Compass: RVOL provides critical insights into trading volume compared to historical averages, offering clues about potential price movements before they happen. This can be your compass in the often unpredictable seas of the stock market, guiding you towards informed trading decisions.
- Strategic Edge: Incorporating RVOL into your trading strategy offers a strategic edge, allowing you to detect anomalies in trading volume that signify mean reversion opportunities, breakouts, and other pivotal market movements.
- Informed Decision-Making: By understanding the nuances of RVOL, you’re equipped to make more informed decisions, distinguishing between mere noise and significant market activities worth your attention and action.
- Customization and Flexibility: RVOL analysis is not one-size-fits-all; it allows for customization to suit your specific trading style, timeframe, and goals. This flexibility ensures that you can adapt and refine your approach as you gain experience and as market conditions evolve.
- Technology at Your Service: The Chart Spots Relative Volume indicator for NinjaTrader 8 automates the analysis and offers real-time insights. Leveraging this tool can save time and enhance accuracy, allowing you to focus on strategy execution.
An Invitation to Explore and Excel
As you stand at the threshold of integrating or deepening your use of Relative Volume in your day trading endeavours, consider this not just an invitation but a call to action. RVOL is more than a tool; it’s a pathway to elevating your trading strategy, offering a clearer understanding of market dynamics and empowering you with the confidence to make swift, informed decisions.
We encourage you to delve into RVOL analysis, experiment with its applications, and witness first-hand how it can transform your approach to day trading. Whether you’re a newcomer seeking to establish a solid foundation or a seasoned trader aiming to refine your strategies, RVOL presents an opportunity to achieve greater market success.
Remember, the journey to becoming a proficient day trader is ongoing, marked by continuous learning, adaptation, and growth. Embrace RVOL as a critical component of your trading arsenal, and let it guide you to new heights of trading mastery and market success. Here’s to your trading journey—may it be informed, strategic, and, most importantly, profitable.


